Summary of "Understanding Music Visualization Through Graphic Images and Mathematical Statistics" by Wei Li and Jiake Li
Written by Miguel Carballo
March 9th, 2025
Introduction
Music has always been an auditory experience, but modern computational techniques are making it possible to visualize music in new ways that can be very useful. The paper Research on Music Visualization Based on Graphic Images and Mathematical Statistics by Wei Li and Jiake Li explores this concept by developing a music visualization model that integrates graphic images, clustering algorithms, and statistical techniques. At its core, the study seeks to determine how mathematical statistics and clustering techniques can enhance the way music is visualized.
This research question is important because music visualization has significant applications in music education, performance analysis, and digital music research. Researchers, educators, and performers can gain deeper insights into musical structures, performance variations, and sonic properties by translating music data into graphical formats. Traditional spectrograms and waveform displays provide only a basic view of musical content, but the authors argue that integrating mathematical models can offer a more structured and informative representation of music. Their proposed approach enhances the accuracy and clarity of music visualization by incorporating graphic imaging techniques, clustering algorithms such as K-means, and statistical models like decision trees and spatial autocorrelation methods.
Research Methods
The authors designed a three-stage methodology involving image processing, machine learning, and statistical analysis to test their hypothesis. The first stage of the study focuses on visualizing airflow and sound waves using Schlieren imaging and Laser Doppler imaging which use the principle of light getting refracted when there is a change of density in a medium, in this case, the air itself which changes the pressure as consequence of sound waves. These techniques allow for a visual representation of sound production, particularly in wind instruments, by capturing the physical propagation of sound in the air.
Beyond these physics-based visualizations, the study introduces statistical graphics as a direct representation of musical content. Figure 3 in the article presents two types of music visualization methods that provide insight into the temporal and structural aspects of music performance. In Figure 3(a), audio thumbnails summarize a musical piece by visually capturing key moments, making it useful for music retrieval and content summarization. In Figure 3(b), a comparison chart illustrates the unit beat duration and beat number space for different versions of a performance which allows the analysis of tempo variations and expressive differences across multiple interpretations of the same piece.

Figure 3 in the paper: Sample music visualization statistical graphics technology. (a) Audio thumbnails (b) Comparison chart of the unit beat duration and beat number space for different versions of singing.
The research applies K-means clustering to categorize music samples based on extracted frequency band features in its second stage. The authors analyze patterns in music visualization and classify them based on their spectral characteristics by using 2000 music samples. In addition to clustering, a decision tree model is introduced to classify music visualization data. They improve classification accuracy by implementing a fusion decision model that combines Gradient Boosting Decision Trees (GBDT) with Logistic Regression (LR).
The third stage of the study applies Moran’s I statistic to determine whether the classified music visualizations exhibit patterns. The authors achieve this by constructing a Moran scatter diagram, which evaluates whether similar classification frequency bands cluster together or appear randomly distributed.
Key Findings
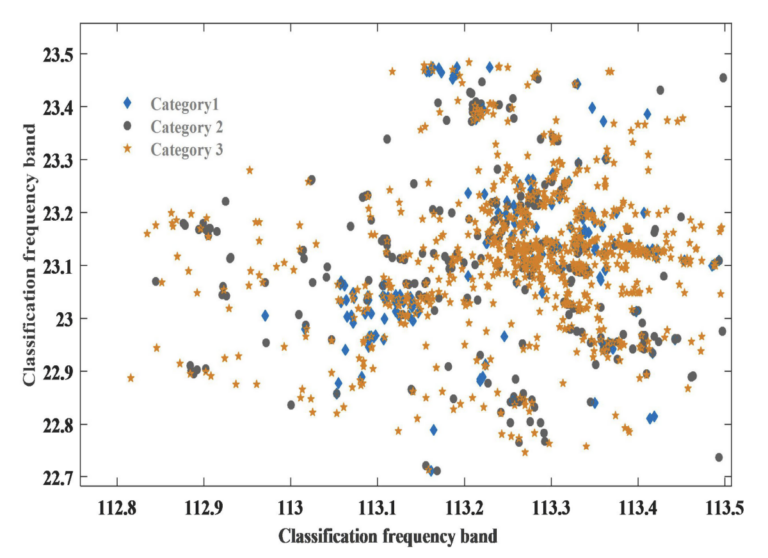
One of the most interesting aspects of the study is its use of spatial autocorrelation to detect clustering in music classification. Figure 5 presents a 3D Moran scatter diagram where both axes represent test set samples, while the vertical axis represents classification frequency bands, which are the average value of the frequency in a song. These Moran scatter diagrams help to visualize the relationship between a variable’s values at different locations and the spatially lagged values of that same variable, helping to evaluate spatial autocorrelation patterns such as clustering or dispersion.

Figure 5 in the paper: Visualization of K-means clustering results with Moran scatter analysis, showing classification frequency bands and spatial autocorrelation of test samples.
The results demonstrate that certain music classification groups exhibit clustering, suggesting that music visualization follows identifiable patterns rather than being randomly distributed. This finding reinforces the argument that mathematical models can effectively categorize and analyze musical content by showing classification frequency bands since they have structured distributions.
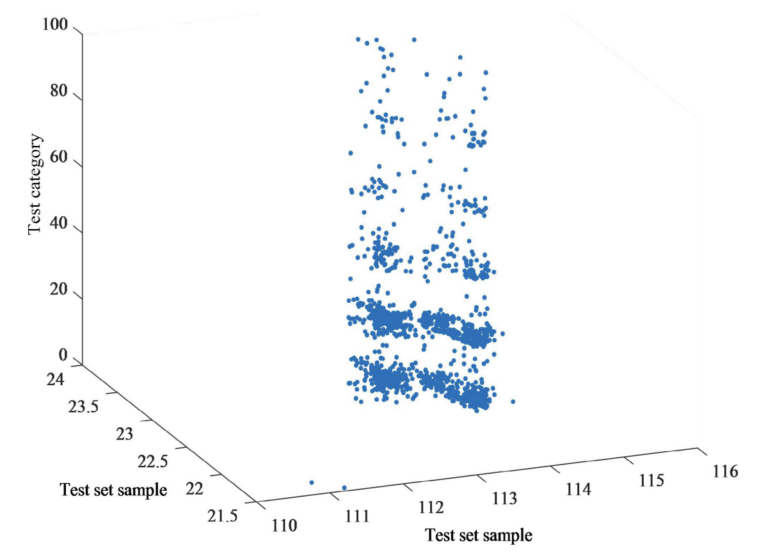
Another significant finding is related to the classification models used in the study. For example, Figure 8 presents a 3D visualization of the classification results from the fusion decision tree model (GBDT + LR), showing only the predicted classifications. The X-axis and Y-axis both represent test set samples, forming a classification matrix where each sample is positioned relative to others, while the Z-axis represents the predicted category assigned by the model. This visualization helps evaluate the structure and distribution of the predictions, revealing whether the fusion decision tree model generates more organized and accurate classifications. The well-structured pattern in this figure indicates higher classification performance and suggests that the fusion model (which integrates GBDT and LR) provides a more structured and accurate classification of music visualization data.

Figure 8 in the paper: Music visual classification results based on decision tree combined with Logistic Regression.
Limitations of the Study
Despite the results, the study has certain limitations: one of the main drawbacks is the limited scope of musical analysis. The study primarily focuses on frequency band classification and does not extensively explore melodic, harmonic, or rhythmic aspects of music even though they are mentioned as relevant to expand. Therefore, while frequency features provide valuable insights, a more comprehensive analysis that includes note sequences, chord progressions, rhythmic structures and their relation among them as predictors would be beneficial.
Another limitation concerns potential data bias. The dataset consists of 2000 music samples, but the authors do not provide detailed information on the sources of these samples. This could raise concerns about whether the dataset is sufficiently diverse and representative of different musical styles.
Also, some aspects of the study require a high level of expertise to interpret. The accessibility of certain figures, particularly the Moran scatter diagrams, is limited by the need for specialized knowledge in spatial statistics.
Furthermore, the study does not explicitly describe the features (besides mentioning the number of them) used for classification, making it difficult for other researchers to replicate the experiment. A clearer explanation of how classification features were selected, even just for the case study, would enhance the study’s transparency and reproducibility.
Conclusions
The research provides an interesting perspective on music visualization by combining machine learning, statistical analysis, and image processing. The study proposes that music visualization can be enhanced using clustering and statistical techniques by integrating multiple analytical approaches. The combination of decision trees and fusion models improves classification accuracy, making it possible to detect patterns in music that were previously difficult to visualize. Additionally, the study reinforces the idea that musical sound characteristics follow structured patterns rather than being randomly distributed by applying spatial autocorrelation analysis.
The findings open new possibilities for automated music analysis, performance interpretation, and education tools. The methodology used in this study could be extended to include more musical features beyond frequency bands. Future research could explore applications such as gesture-based music performance tracking, AI-assisted composition, and near real life interactive music visualizations. Besides, researchers could develop more advanced visualization models that capture the full complexity of musical expression by integrating more comprehensive datasets and refining the classification process. At the same time, these new ways to visualize music could be extended to deeper research linked with the music classification topic, which could have a deep impact in streaming platforms based on common characteristics due to factors that were not taken into account before.
In general, this study represents a step forward in the field of music visualization, offering a framework that includes modern statistical tools and techniques. The integration of mathematical models in music visualization enhances analytical clarity and also paves the way for more innovative applications in digital music research.
Questions:
The paper presents a structured approach to music visualization using statistical and machine learning techniques but it also raises important questions about how effective and practical these methods really are. Some of these questions are:
- How does the effectiveness of the proposed music visualization techniques align with principles of visual encoding and perception?
- Would alternative techniques offer a better way to uncover relationships in music data for musicians, learners or researchers?
- Could linking multiple views (such as a decision tree structure alongside the 3D classification results) improve interpretability?
- Does the dataset of 2000 music samples represent a diverse range of musical styles/sounds, or does it introduce biases that could affect visual representation and also classification accuracy?
